

Tracing the movement of GDP and its components in the last decade, this article suggests steps to make our economy attain a high growth path. For this purpose, three distinct phases of growth post 2011-12 have been analysed. In the first phase till Q3 of 2016-17 growth averaged 7.2 per cent in 19 quarters. The second phase, from Q4 of 2016 -17 to Q1 of 2020-21, showed an average growth of 5.7 per cent. The third phase from Q2 of 2021 showed a V-shaped recovery followed by moderation. Cyclical and structural factors have played a role in these three phases of growth. We believe the overall growth in 2022-23 would be around 6.5-7 per cent. Demonetisation, GST and Covid might have played a role in either accelerating or reducing the effects of structural change.
The purpose here is to analyse if if growth is aligned to its potential during these three phases. Estimating output gap is difficult, not because it can only be observed, but it is also dynamic. Based on both Hedrick-Prescott (HP) filter (which separates the short term from the long term) and auto regressive integrated moving averages (ARIMA) studies and along with economic indicators approach (which uses past observed relationships for assessment of the future), we conclude that the potential of our economy is currently below 6 per cent. ARIMA studies point to a potential output of less than 6 per cent for 2021-26.
While assessing fluctuations of components of growth during this period, we find wide fluctuations in growth patterns for industries, comprising utilities, manufacturing and construction, while in the case of services, they were more range bound. There has been relatively stable growth in services partly because most of these are non-traded, and hence insulated from global changes.
Credit and capital formation
Deceleration in the growth of industry is closely related to the growth of fixed capital formation. This is in turn because of lower revenue growth and persistence of continued revenue deficit of governments, which constrained capital formation. Non-food credit (NFC) as ratio of GDP declined until Q4 of 2017-18, but witnessed an upsurge later due to moratorium on repayment and EMIs during the pandemic.
The informal sector had difficulty in accessing resources and problems in real estate impacted construction activities. Export growth in the entire period was less than the GDP growth, though it was volatile. Demonetisation and GST roll-out did really help in recovery of growth of exports. In the last four quarters, exports have performed well.
Gross fixed capital formation (GFCF) showed a downturn in the last three quarters of 2021-22. Growth in GFCF was even lower during 2012-15. Private final consumption expenditure (PFCE) was range bound during this decade except in the first two quarters of 2020-21. But, a longer period of growth slowdown from Q1 2016-17 cannot be attributed to PFCE and GFCF only.
On the influence of institutional credit on demand side factors, NFC as per cent to GDP decelerated from Q2 of 2014-15 till Q3 of 2018-19. Its moderation in 2016-19 would be partly due to demonetisation and GST roll-out. An assessment of private consumption expenditure shows that the composition has not undergone any change in recent years.
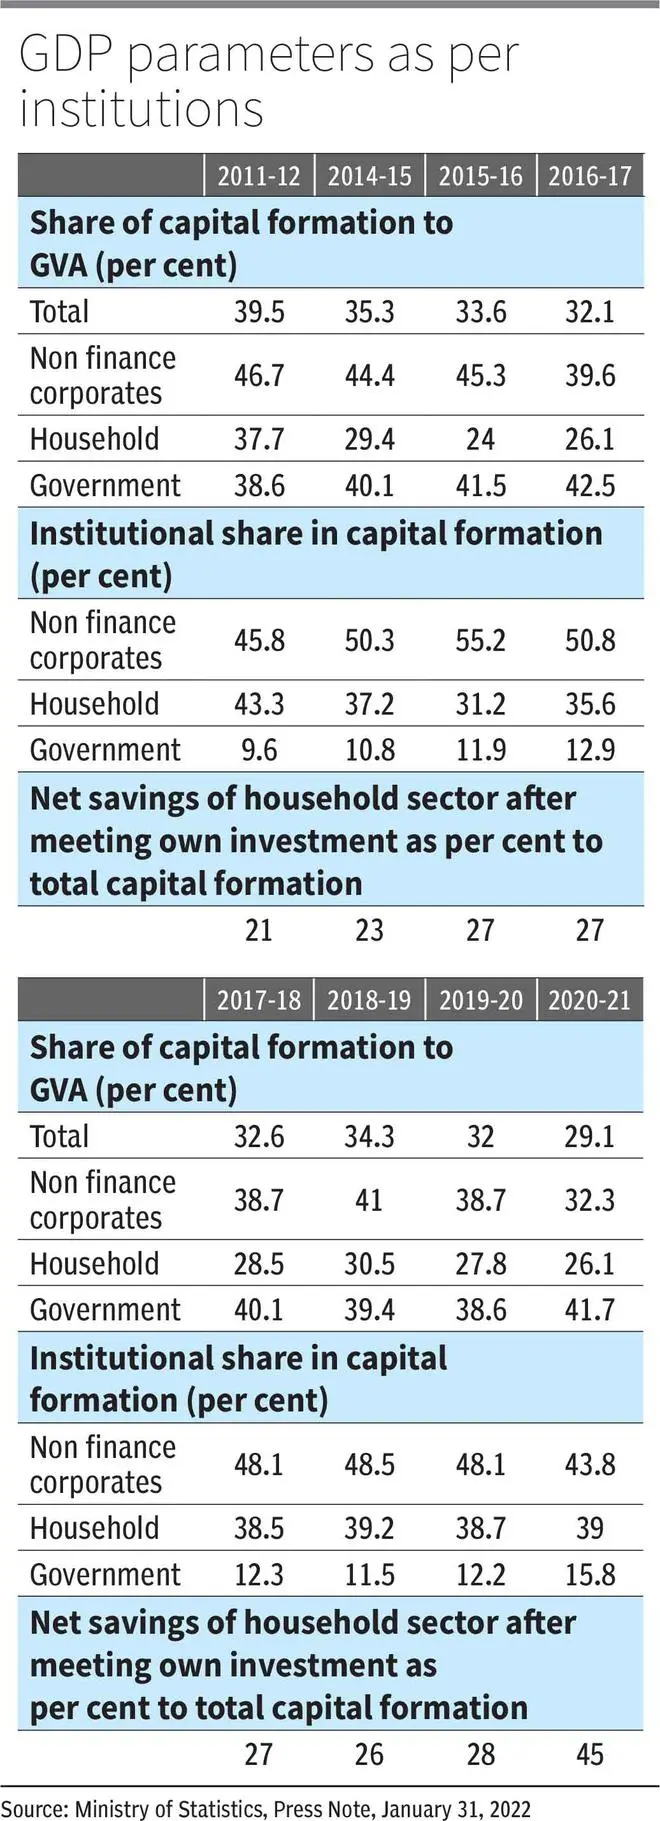
An analysis of investment reveals that in 2011-21, non-financial corporate sector made nearly three quarters of investment from internal accruals. Surprisingly, its share in capital formation declined from 46.7 per cent in 2011-12 to 32.3 per cent in 2020-21. Surplus funds with unincorporated enterprises and household witnessed steady increase during this period. As a result, net financing from household sector increased from 21 per cent of total investment in 2011-12 to 45 per cent in 2020-21.
A large number of persons have emerged as non-participants in the labour force for quite some time. It is even worse in females across the country at 50 per cent of the level of their male counterpart. From PLFS 2021 we see an inverse relationship between level of education and employment.
Expectations play a role in investment decisions. The RBI conducts periodic surveys on business expectations, consumer confidence and business assessment. The expectation index has gone muted in Q4 of 2021-22. Business assessment indicators show that they are lagging business expectation indicators. Consumer confidence is also not showing any buoyancy from Q1 of 2019-20. Capacity utilisation has remained sticky at around 70 per cent. Since life of a product has shortened, capacity utilisation surveys must cover new entrants. Static capacity utilisation even during pent-up demand clearances shows excess capacity is available. This depresses new capital formation.
Incremental Capital Output ratio (ICOR) is a surrogate measure of efficiency of the economy. In the first phase of growth, ICOR was 4.51 and in the second phase, it reached 5.52. If gross capital formation remains at 30-32 per cent, 6.0-6.2 per cent can be the likely achievable growth over the medium term. Formalisation of the economy and sectoral shift to services in general can lower ICOR.
Structural factors
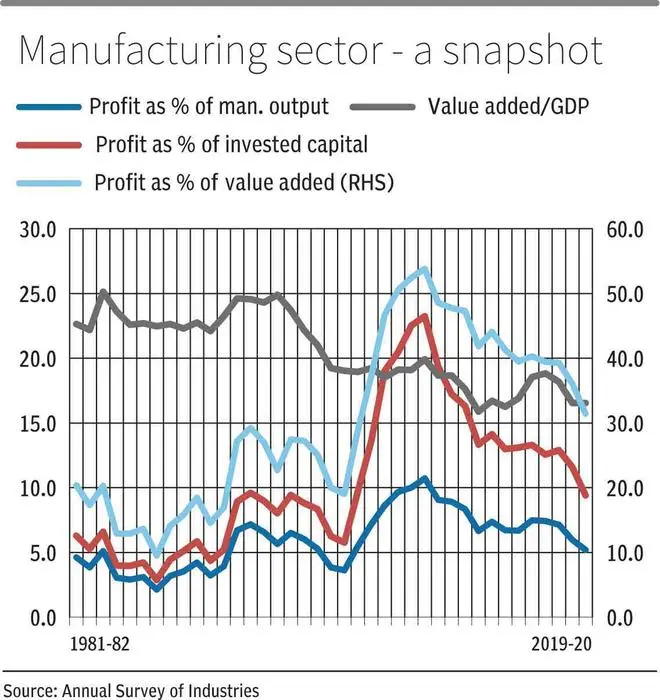
The ratio of manufacturing value added to output has declined from 25 per cent during 1983-94 to 16.6 per cent in 2019-20. High resources intensity of consumables has led to this situation. Industry can, therefore, hardly afford to invest in technology, innovation and compensation of skilled workers. Schemes like Make In India and Product Linked Incentives should distinguish between assembling and manufacturing.
Economic recovery is the function of three Es — buoyant expectations, expansion in expenditure on investment, and consumption and efficiency in use of resources. Currently forward-looking confidence level indicates that serious structural and cyclical measures are required to be taken by the Government to boost investment. Manufacturing and services are also seen to be less efficient. So, an accelerated growth in investment and consumption is required to shift the economic growth trajectory upwards.
Consumer sentiments in the medium term can be improved through stable policy regime, improving law and order, taking measures for ease of doing business, improving innovation, facilitating openness in the economy, including in trade regime, creating stability and predictability of tax regimes, developing and enhancing efficiency of infrastructure, solving problems of specified sectors besides improving labour force participation.
A 5 percentage point increase in labour participation rate could increase GDP growth by 0.71 per cent. Political, religious and social leaders should put their heads together to facilitate increase in labour force participation and more so in female labour force participation.
Gopalan is a former Finance Secretary, and Singhi is a former Senior Economic Adviser, Ministry of Finance
![]() Comments
Comments

Comments
Comments have to be in English, and in full sentences. They cannot be abusive or personal. Please abide by our community guidelines for posting your comments.
We have migrated to a new commenting platform. If you are already a registered user of TheHindu Businessline and logged in, you may continue to engage with our articles. If you do not have an account please register and login to post comments. Users can access their older comments by logging into their accounts on Vuukle.