

The Sensex and Nifty have moved up by 6.6 per cent and 8 per cent respectively so far this year. Even though volatility shot up temporarily during the announcement of the election results, the bellwether indices have continued to move up since then.
But coming to the sectors, the performance has varied. So far this year, Nifty Realty and Nifty Auto — up 44 per cent and 38 per cent respectively — have been the leaders whereas Nifty Media and Nifty IT, down 14 and 3 per cent respectively, have been the laggards.
Given the divergence, we took a look at the charts of key sectoral indices and have identified the potential outperformers, going ahead, based on technical analysis.
To ride on the likely outperformers, investors can go for index funds or ETFs (Exchange Traded Funds) based on the indices. But keep in mind that you should choose passive funds based on parameters such as liquidity, expense ratio, tracking error and tracking difference, among other things. In the absence of a fund mirroring the index or if you wish to place your bets on individual stocks, we have suggested stocks (which are constituents of the index) that appear bullish on the charts.
Nifty IT (34,599)
2024 has not been good so far for the IT index. It has been one of the weakest sectors by losing 3 per cent year-to-date. However, in the first week of June, the index gained sharply. Notably, it bounced off a long-term trendline, which it met at 31,700. Also, the trend has been bullish since April last year and so, the decline in the first half of this year is more of a corrective move.
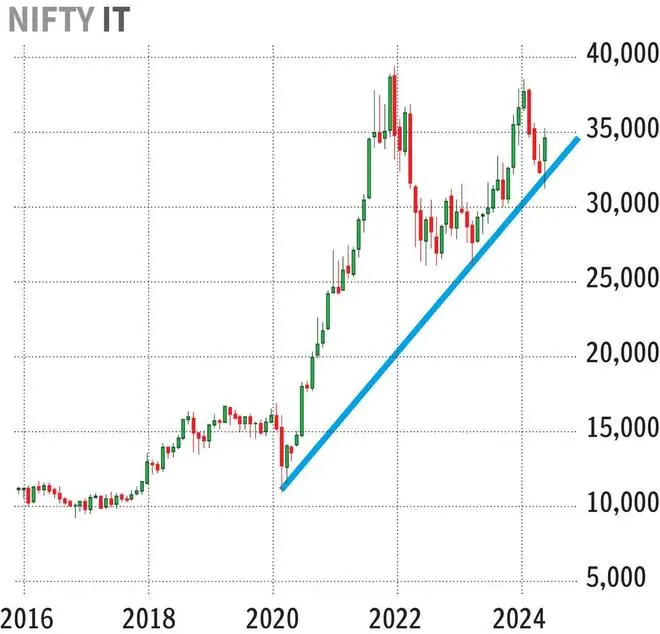
As per the chart, the medium-term trend will be bullish so long as the support at 30,000 stays valid and the long-term trend will come under test only if Nifty IT slips below 26,300. We expect the index to begin a rally from here, which can sustain for the next two to three years.
Going ahead, Nifty IT is expected to surpass the prior high of 39,447 and appreciate to 50,250 in about two years. That said, en route to 50,250, potential resistance levels are at 43,000 and 45,800. These levels are based on Fibonacci extension. Once the index touches these levels, we might see a minor corrective decline. But bearish trend reversal can happen only after Nifty IT hits 50,250.
Hence, for investors looking for long-term investments, the IT sector offers good opportunities.
Strategy: Those who wish to take exposure to the index can consider the mutual fund route and go for Nifty IT index funds/ETFs, many of which are available across fund houses.
Buy now and add more units when the index drops to 30,000. Keep stop-loss at 25,800. When the index goes above 40,000, trail the stop-loss to 36,000. Adjust the stop-loss up to 41,500 when the index touches 45,000. Liquidate at 50,000.
For participants looking for stocks, HCL Technologies and Wipro appear good on the chart. These are expected to do well over the next few years.
Supports: 30,000 and 26,300
Resistances: 40,000 and 50,250
Nifty Media (2,058)
Nifty Media, unlike most other sectors, has so far only seen a limited recovery post the 2020 fall. While almost all sectoral indices have made new life-time highs post the Covid fall, Nifty Media is still at a 44 per cent discount compared to its lifetime high of 3,675.8, made in early 2018. Even this year, by losing 14 per cent YTD, it has been the worst performing sector so far.
But tides are turning and the index shows potential for an upswing, going ahead. This time, it could get past the nearest barrier at 2,500 in the coming months and extend the rally to retest the critical level at 3,675.
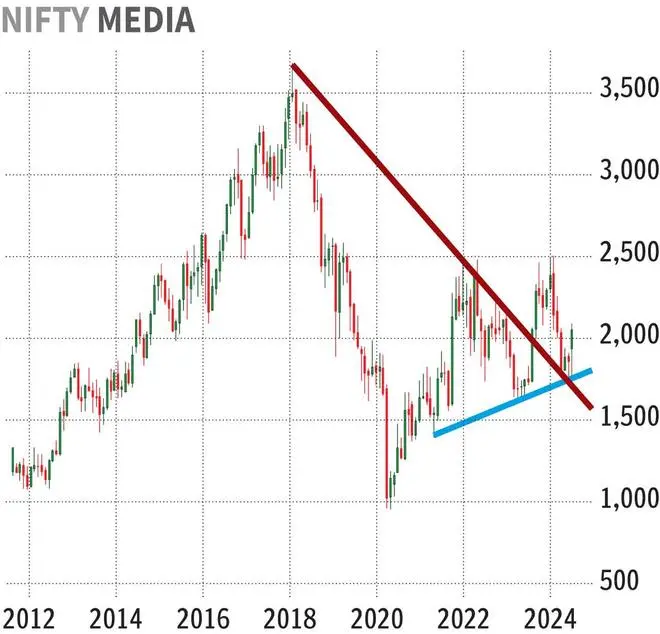
Since the final quarter of 2021, Nifty Media has been stuck in the broad 1,660-2,500 range. There are chances for the index to remain below 2,500 for the next few months. However, as we mentioned above, we expect it to eventually break out of 2,500 and establish a long-term uptrend.
A rally past 2,500 can happen before the end of the first quarter of next year. Once this occurs, we can expect a rally to 3,600 within two years post the breakout. That said, there are a few price areas that can act as a supply zone, possibly leading to a decline. Those are 3,000 and 3,300.
Nevertheless, such dips are expected to be short-lived and can be seen as buying opportunities. Till the support at 1,660 remains valid, the broader trend will be positive. Therefore, investors who wish to bottom-fish can look at the Nifty Media index.
Strategy: While there are no index funds/ETFs available for Nifty Media, investors can buy stocks in the index to capitalise on this potential upside. Zee Entertainment Enterprises and Sun TV Network together constitute 42 per cent of Nifty Media. Also, technically, these two stocks display considerable upside potential. So, investors can split the investment intended to media stocks to two halves and buy these two stocks.
Supports: 1,660 and 1,000
Resistances: 2,500 and 3,600
Nifty FMCG (57,226)
Although the overall trend is bullish for Nifty FMCG, the index has not been doing well so far in 2024. This index is among the top laggards despite the recent rally. However, it is not gloom and doom for the index as the prospects, especially for the next two to three years, appear good.
The upswing this month has given hope for the bulls. Two weeks ago, the index bounced off the 50-week moving average, which is currently at 53,710, and hit a record high of 58,832.65. It is now hovering above 57,200.
While the momentum is in favour of bulls, we cannot reject the possibility of the index moderating before the next upswing. A possible correction from here can drag Nifty FMCG to 52,000. The price band of 51,000-52,000 is a demand zone. In addition, there is a long-term rising trendline support that can arrest the fall. Only a breach of these supports can overturn the uptrend.
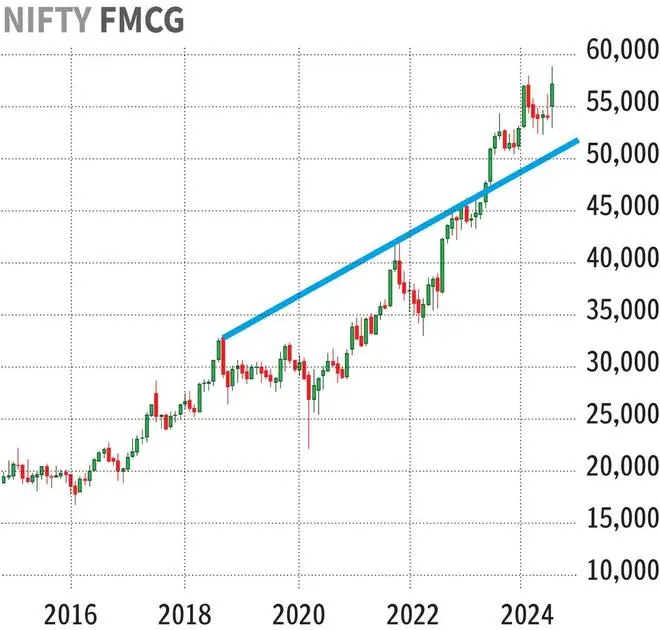
Eventually, we expect the index to witness an upsurge, which can lift it to 69,000 over the next couple of years. Note that the price region between 69,000 and 70,000 is a resistance. After Nifty FMCG reaches this level, there could be a fall.
As it rallies, the index can face hurdles at 61,400 and 63,500. The former is a minor one and so the bulls can ease past whereas the latter can trigger a decline but nothing more than a corrective one.
Strategy: Considering the above, we recommend that investors buy index funds/ETFs in two tranches and hold until the Nifty FMCG index hits 69,000. ICICI Prudential Nfity FMCG ETF is the only fund with Nifty FMCG as benchmark. If you are comfortable with other aspects of the ETF as mentioned in the beginning, you can invest here.
Investors can buy now and at 52,000 with initial stop-loss at 47,500. Book profits at 69,000.
If you aren’t comfortable, consider investing in stocks in this sector which show potential. The charts of Dabur India, Marico and ITC hint at a considerable rally from their current levels. The first two stocks have seen a fresh breakout, which aligns them with the overall bull trend, increasing the odds of a rally. The price action of ITC indicates that the corrective decline could be coming to an end and a fresh leg of rally can begin.
Supports: 54,000 and 51,000
Resistances: 63,500 and 69,000
Nifty Private Bank (24,777)
Nifty Private Bank, since December last year, has been tracing a sideways trend. The index was oscillating between 22,800 and 25,000. Early this month, the index saw a spike on the back of a rising trendline support at 23,000. In addition to the trendline, its 50-week moving average at 23,550 aided its move up.
The chart indicates that the broader trend is bullish, and the index is likely to break out of 25,000. But having said that, it could see a decline before the eventual breach of the upper boundary of the range. The downswing from here, if it occurs, is less likely to go beyond the support at 22,000. Nifty Private Bank index has got a strong base at 22,000 and 20,500. Until the latter remains valid, the trend will be bullish.
Once the index surpasses the barrier at 25,000, it can open the door for a fresh leg of rally. This upswing can take Nifty Private Bank to 32,500 before the end of next year. There could be intermittent corrections during the course of the up move. Such corrective dips can happen at 27,000 and 30,000.
Strategy: Quite a few fund houses offer ETFs based on Nifty Private Bank
One can initiate longs now at 24,770 and accumulate if the index drops to 22,000. Stop-loss can be at 20,000. When the index surpasses 27,000, modify the stop-loss to 24,800. Once the index tops 30,000, raise the stop-loss further to 28,000. Liquidate the longs at 32,000.
IDFC First Bank, City Union Bank and Kotak Mahindra Bank are the constituents in Nifty Private Bank that can appreciate well.
Supports: 22,000 and 20,500
Resistances: 30,000 and 32,500
Nifty Pharma (19,896)
Nifty Pharma, which began its recent leg of rally in March 2023, entered a consolidation phase in March this year. 19,400 stopped the bulls. But since then, the index was charting a horizontal path and did not see a fall. It was fluctuating between 19,400 and 18,300.
With this background, Nifty Pharma gathered strength and surged past the upper end of the sideways band a couple of weeks ago. The leg up was assisted by a rising trendline support. This breakout move has set the tone for Nifty Pharma to see another round of an upswing.
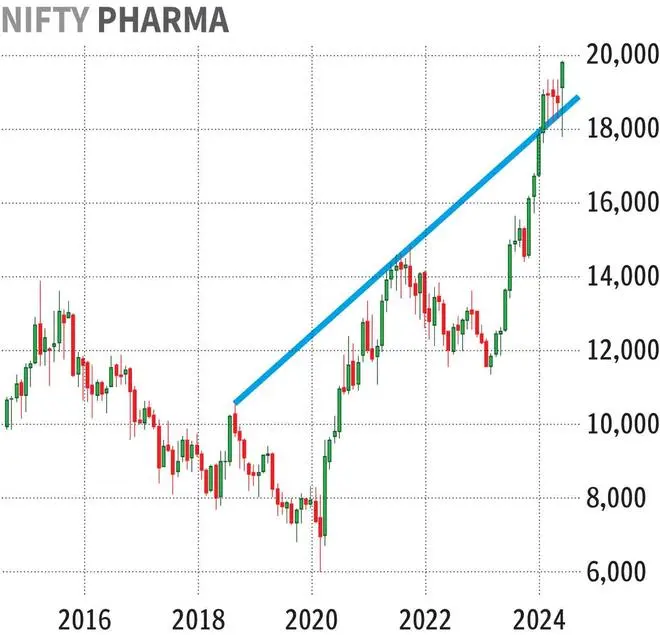
Substantiating the bullishness, the price action on the weekly chart shows a confirmation of a bull flag pattern. As per this chart set up, the index is likely to soar to 23,600 quickly. That said, given the momentum, we forecast Nifty Pharma to touch 24,000 before the end of 2025.
Although the rally can be sharp, the index can face barriers at 21,800 and 22,500. These resistance levels might not trigger a bearish trend reversal but can lead to minor corrective declines.
In case Nifty Pharma makes a U-turn and falls below the support at 18,300, the short-term trend can become bearish. Nevertheless, so long as the base at 16,000 remains true, the long-term inclination will continue to be bullish.
Strategy: Nippon India Nifty Pharma ETF and ICICI Pru Nifty Pharma Index are the two funds available with Nifty Pharma index as benchmark.
If you are comfortable with other metrics relating to the passive funds as mentioned in the beginning, buy now at 19,900 and buy more units if the index dips to 18,600. Place stop-loss at 17,500. When the index reaches 22,000, raise the stop-loss to 20,000. When the index hits 23,000, alter the stop-loss to 21,500. Book profits at 24,000.
I You can consider pharma sector stocks as well. Torrent Pharmaceuticals, Sun Pharmaceutical Industries and Biocon have the potential to be the standout performers, according to the charts. The stock of Torrent Pharmaceuticals continues to exhibit strong bullish momentum whereas Biocon confirmed a bullish trend reversal in early 2024. Sun Pharmaceutical Industries is now showing signs of resumption of the uptrend after a correction.
Supports: 18,300 and 16,000
Resistances: 22,500 and 24,000
![]() Comments
Comments

Comments
Comments have to be in English, and in full sentences. They cannot be abusive or personal. Please abide by our community guidelines for posting your comments.
We have migrated to a new commenting platform. If you are already a registered user of TheHindu Businessline and logged in, you may continue to engage with our articles. If you do not have an account please register and login to post comments. Users can access their older comments by logging into their accounts on Vuukle.