
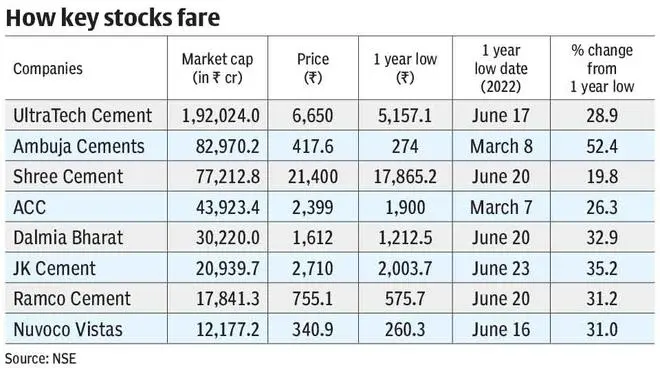
Cement companies have been hit hard in the June 2022 quarter, with aggregate profits for listed players falling about 22 per cent year on year. While reasonably good volume growth and price increases helped aggregate sales grow 24 per cent year on year, cost pressures, especially from rise in power and fuel costs, pulled down profitability. Aggregate EBITDA margin saw a decline of 9.2 percentage points year on year in the quarter ended June 2022 and came in at 17.4 per cent . Many top players touched their one-year lows in June this year, thanks to the headwinds. With cost pressures cooling off a bit, stocks have also rebound since then.
Going forward, the prospects for the industry look positive with growth expected to be led by the infra segment which accounts for nearly 25 per cent of demand for cement. Several government schemes such as MGNREGA, PM Garib Kalyan Rozgar Abhiyan and State-level schemes such as Matir Srisht (West Bengal) and public work schemes (Jharkhand) are expected to aid demand too. If high interest rates don’t play spoilsport, retail housing projects, including rural housing, are expected to pick up.
Here is a brief overview of the industry and the factors that investors need to know when investing in cement stocks.
Industry lowdown
The total installed cement capacity of the country is around 500 million tonnes per annum (MTPA) with production of 298 MTPA. This makes the Indian cement Industry the second largest in the world after China. The top-20 cement producers in the country contribute to nearly 70 per cent of volume in the country. The industry is concentrated in the western and and southern regions.
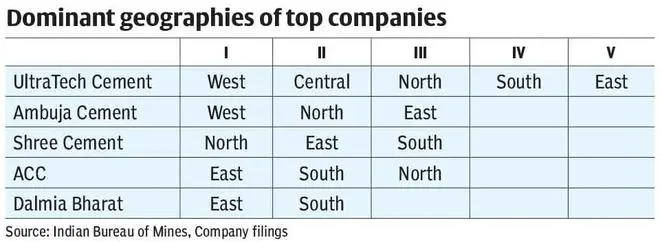
The cement market can be broadly divided into five zones — North, South, East, West, Central. Among the big players, UltraTech Cement, being the largest player in the industry, has significant presence across all the zones. Shree Cement has a significant presence in the North zone.
Over the years, the industry has seen consolidation with smaller players being acquired by larger ones. Examples include UltraTech’s acquisition of Binani Cement as well as the merger of the cement business of Century Textiles. In May, Holcim announced the sale of its stake in Ambuja Cements and ACC to the Adani group for about ₹50,200 crore. The Adani group will now become the second largest player in the industry giving it a favourable position in the West and North zones, which have been enjoying good pricing in recent times.
Material sourcing and costs
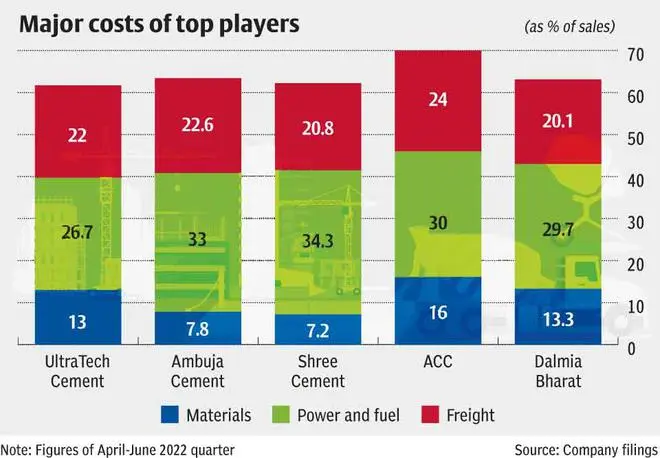
In the cement industry, there are three main components of costs: power and fuel , freight and logistics , and raw materials. Power and fuel involve crude oil, coal and pet coke; logistics cost is highly dependent on crude oil prices. The key raw materials that go into the production of cement are limestone and clay, which are available in the country. Fly ash from power plants and blast furnace slag from steel plants are also added. It may, therefore, not be a surprise when we see a cement unit located strategically near a power plant or a steel plant.
For fuel and power, most of the companies use imported coal and pet coke whose prices are determined in international markets and are vulnerable to geopolitical risks and currency rate risk. Although cement companies can use domestic coal (grade 7 or higher), power producers have preferential allotment of coal and hence other manufacturers need to rely on imported coal. The total supply of coal and lignite to cement industry by Coal India and Singareni Collieries has largely remained stagnant over the last three years, leading to higher import dependence, according to Hetal Gandhi, Director, CRISIL Research.
On the raw material front, most of the companies have captive limestone mines and participate in auction as and when required. According to an Ambit Capital Report put out in March, UltraTech Cement has 4.5 billion tonnes of limestone reserves, followed by Shree Cement with 2-2.5 billion tonnes and ACC, Ambuja Cements and Dalmia Cements have around 1 billion tonne of limestone reserves each.
Power and fuel and logistics cost have been in the range of 20-25 per cent of the sales revenue each and the raw material cost has been in the range of 10-15 per cent of sales revenue from FY18 till FY22 for the top companies. Hence, companies which are able to optimise costs enjoy better EBITDA margins. Besides, companies have been trying to find alternate routes to reduce its power bill and along with it, start being ESG-compliant too. One of the ways to do this is by using Waste Heat Recovery System (WHRS). Companies also use materials such as rubber crumbs, pharma waste and municipal waste for fuel. The average rate of blending is 5-10 per cent, but few companies have been able to take it up as much as 25 per cent, says Gandhi.
Take Shree Cement, for instance. According to a recent Nirmal Bang report, Shree Cement, for instance, usually targets cheaper fuel and it uses 100 per cent pet coke for cement production which is a cheaper alternative. The company meets 50 per cent of its power requirement through WHRS, thus reducing coal requirement. The company is also increasing its solar power capacity which is expected to add ₹50-60 crore to the bottom line. These cost control measures are a reason why Shree Cement enjoys a premium valuation
UltraTech generates 1,188-MW power, out of which 436 MW (36.67 per cent) is from WHRS, windmill and solar.
In recent times, costs under various heads escalated for companies in the wake of the Russia-Ukraine war. Pet coke prices almost doubled from $210 per tonne in December 2021 to around $400 per tonne in May 2022, but has cooled down to $190 per tonne in August. Another important source of fuel is imported coal, the price of which was $142.5 per tonne in December 2021 and touched $280 per tonne in May 2022, while it is $413.5 now. In March, the price of Brent went up to as high as $134.9 per barrel, but has cooled down to $95.8 per barrel now. Apart from options such as WHRS, companies are also trying other alternatives to control costs.
For example, it was reported recently that UltraTech has procured 1.57 lakh tonnes of coal from Russia by paying in Yuan. The total cost worked out to be around $165 per tonne vs global prices of $397 per tonne Another recent media report by Reuters mentioned that Indian cement companies have started procuring pet coke from Venezuela at a discounted price vis-à-vis the US. While pet coke has higher energy content than coal, it pollutes more than coal too.
Pricing
Apart from cost control, pricing is a very important aspect which has significant impact on the margins of the companies. As per a recent JM Financial report, the average all-India cement price in Q1 FY23 was ₹394, 3.8 per cent higher than the preceding quarter and 5.5 per cent higher than Q1 FY22. If one looks at the regional markets, the Eastern market has been the weakest in terms of pricing and has lagged from other regions. There was no change in price in the Eastern markets in Q1 FY23 from Q4 FY22; the price was stagnant at ₹357. Even on a year-on-year basis, the price growth was 2.8 per cent while in other markets like West and Central, the year-on-year growth was 7.9 per cent and 12.2 per cent respectively.
Prices in the North and Central markets have consistently grown from March 2019 to March 2022. Price of per cement bag in the Northern market has grown at a CAGR of 6.97 per cent in this period to ₹398. In the Central markets, the price per bag in March 2019 was ₹347, whereas in March 2022 it was ₹370. It must be noted that in these two markets price has been growing steadily over the past four financial years without much glitch.
The Western markets have also been reasonably stable. The Western market has the highest per capita consumption in the country, whereas the Eastern market has the least per capita consumption, giving more room for penetration and growth.
The Eastern market is expected to drive the demand in the medium term, on account of increased infrastructure spending by the government and lower base. Hence, players with a presence in this region or upcoming capacities in this region will benefit. Ambuja Cements has planned for a 7-MTPA capacity expansion Sankrail and Farakka in West Bengal and a greenfield grinding unit at Barh, Bihar; Shree Cement is establishing a 3-MTPA unit in Purulia, West Bengal. ACC has ongoing projects in Sindri (Jharkhand), Tikaria and Salai Banwa in West Uttar Pradesh. Dalmia is increasing its brownfield capacity in Calcom, Assam (1.2 MTPA), Mednipur, West Bengal (0.6 MTPA), and Kapilas, Odisha (0.4 MTPA).
Making the choice
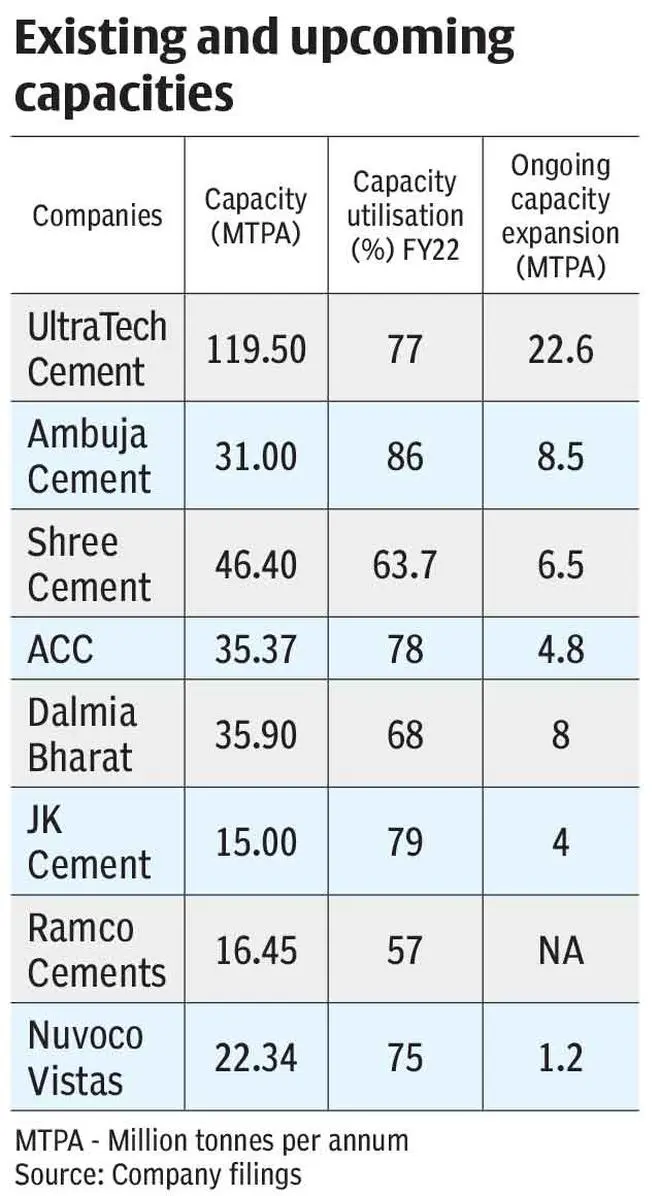
Thus, investors in cement stocks should consider factors such as access to raw materials, cost control efforts, pricing stability capacity utilisation and expected benefits from the upcoming capacities of companies before they arrive at a short list of stocks. Coming to the financials, two factors can be considered. One, debt levels of companies, especially for those embarking on capacity expansion. For instance, UltraTech, which is adding about 22.6 MTPA capacity now, has seen its net debt to EBITDA for FY22 come down to 0.53 times compared to 3.14 times three years ago.
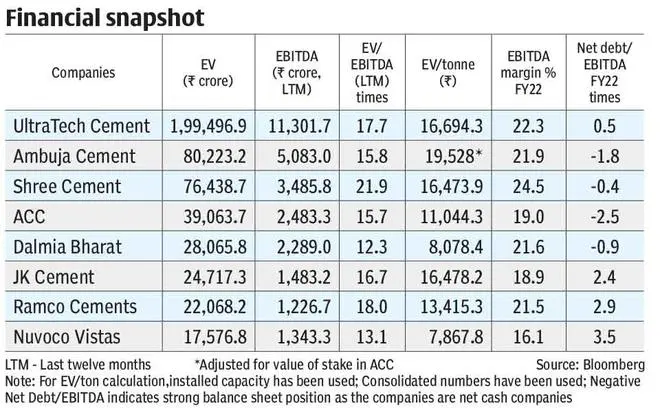
Two, the valuations need to be considered. EV/EBITDA and EV/tonne are widely used for valuing cement stocks. EBITDA is a proxy for cash flows and reflects operational profits. It gives an idea of how many years of current-year cash flows are required to make up for the value of the firm (market cap + net debt), represented by the Enterprise Value or EV. When compared with peers or historical average, a lower ratio generally indicates under valuation. Using EV/EBITDA as a metric to value stocks is common across industries where leverage is widely prevalent and businesses are capital-intensive, including cement.
EV/tonne is used in sectors such as cement and metals to assess whether the stocks are trading above or below their replacement costs (cost of setting up a new plant). Of course, the valuations should also be seen in the light of how companies are placed on other factors mentioned earlier, before you zero in on a stock. The accompanying tables puts out these metrics for key companies.
(With inputs from Parvatha Vardhini C)
![]() Comments
Comments

Comments
Comments have to be in English, and in full sentences. They cannot be abusive or personal. Please abide by our community guidelines for posting your comments.
We have migrated to a new commenting platform. If you are already a registered user of TheHindu Businessline and logged in, you may continue to engage with our articles. If you do not have an account please register and login to post comments. Users can access their older comments by logging into their accounts on Vuukle.