Motilal Oswal Mutual Fund has unveiled two offerings in the form of Motilal Oswal S&P BSE Enhanced Value Exchange Traded Fund (ETF) and Index Fund. The value-oriented equity MF category in India is dominated by actively-managed products, though in recent times some passive schemes have been launched based on the Nifty 50 Value 20 index. In this backdrop, the NFOs by Motilal Oswal are interesting as they mark the debut of funds that aim to track the S&P BSE Enhanced Value Total Return Index (TRI), subject to tracking error. The NFO period closes August 12. Here is a look at the index and what the funds offer.
Value investing
Investing in companies that are relatively inexpensive compared to their fundamentals with a large margin of safety is the basic tenet of all value investing approaches. In case of actively-managed funds, the fund manager takes active calls on stocks. In case of passive schemes such as ETF or index fund, the stock selection and portfolio management is done by mimicking an underlying index. After stellar performance in 2000s (when value-enhanced index tripled between 2005 and 2010), value investing was an underperformer during 2010-20 (2 per cent CAGR). However, there has been a sharp turnaround with value showing significant outperformance recently. In 2021, the index gained 57 per cent.
Index basics, portfolio
The two new Motilal Oswal MF offerings will track the S&P BSE Enhanced Value Index. This basket measures the stock performance of the 30 companies in the S&P BSE LargeMidcap index (198 constituents) with the most attractive valuations based on a value score that is a composite of metrics such as book value to price, earnings to price and sales to price. The index, launched in December 2015, is re-balanced semi-annually in March and September.
As on June 30, the index’s top-10 constituents (by weight) are NTPC, IOCL, BPCL, ONGC, GAIL India, Coal India, Bank of Baroda, Tata Steel, Federal Bank and Vedanta. Top-10 stocks form 56 per cent of weight, but from a sector point of view, Energy is the top weight (37.9 per cent), followed by Financial Services (28.8 per cent), Commodities (21 per cent), Utilities (9.7 per cent) and Consumer Discretionary (2.4 per cent).
The index comprises five sectors in all, of which three constitute nearly 88 per cent weight. So, the weight of PSUs and sector concentration in this index is uncomfortably high. Due to the depressed valuation of PSUs, the S&P BSE Enhanced Value Index’s trailing price to earnings (PE) at 4.7 times and price to book at 0.75 times is at a steep 70 per cent discount to both the S&P BSE LargeMidcap index and S&P BSE Sensex indices. While this can be marketed as value exposure in a true-to-label tag, it must be taken with a pinch of salt. The index’s dividend yield is high at 6.2 per cent.
The ETF’s indicative Total Expense Ratio (TER) will be 0.30 per cent, while the index fund’s TER will be 1 per cent for regular plan (0.35 per cent for direct plan).
Performance
Value tends to outperform when the market is recovering from a bear market cycle. So, such a factor-based product can be a good way to take advantage of market recovery.

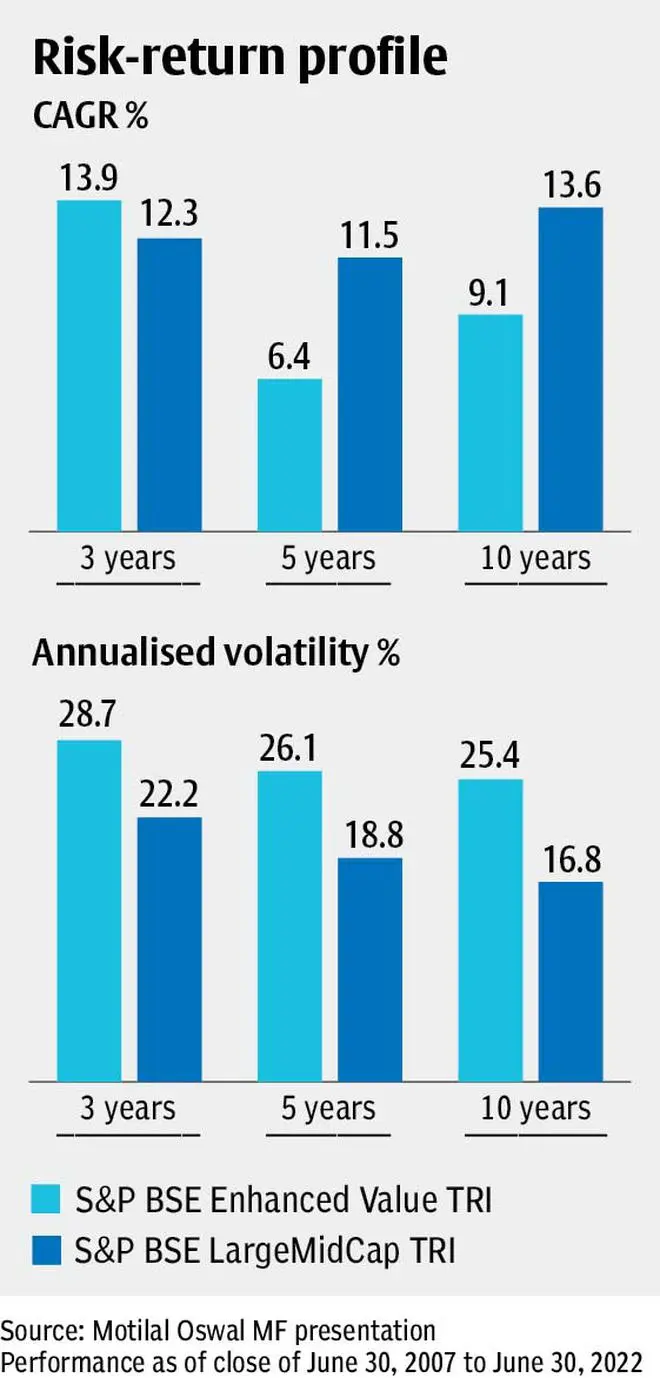
In terms of calendar year returns, the S&P BSE Enhanced Value TRI has outperformed the S&P BSE LargeMidCap TRI in 10 out of the last 16 years (2007 to 2022). Higher return seldom comes without higher risk; while the value basket’s annualised volatility is 600-800 basis points more than S&P BSE LargeMidCap across one-, three-, five- and 10-year periods, value index’s returns are not higher (see table).
In terms of rolling returns, the average return of value index lags the largemidcap index across three-year and five-year periods. Also, do note the S&P BSE Enhanced Value TRI has historically seen larger and more frequent draw-downs than the S&P BSE LargeMidCap TRI. These pointers do not lend much comfort, because classical value portfolios typically don’t display such behaviour.
Final word
Unlike a large-cap focused stock basket where spotting value picks could be tough, this index is comprised of both large-caps (56 per cent) and mid-caps (43 per cent), giving ample scope to get a good blend of value stocks.
The index is skewed towards energy and financials, and has historically been overweight on them too. The dominance of PSUs in the current portfolio adds the PSU theme on top of value. Previous instances of Central government milking PSU coffers by asking for high dividend, nudging companies to merge or diluting stakes at regular occasions acts as a constant overhang. These factors are amply reflected in the depressed valuations. But do note many PSUs stocks are finding currency among investors again.
Underlying index’s historical performance is unimpressive, but that could change in the future if PSUs are re-rated.
Quant-based investing styles, especially for building and maintaining a value-oriented portfolio, often lack the active fund manager edge in terms of interpreting changes, marshalling years of real-world experience and adding market intelligence in portfolio management. Plus, index management teams are often slow in adding or removing stocks.
There are positives and negatives to value investing through this index. While value stocks have recently started performing, poor past performance and PSU dominance makes it fit only for the brave-hearts.


Comments
Comments have to be in English, and in full sentences. They cannot be abusive or personal. Please abide by our community guidelines for posting your comments.
We have migrated to a new commenting platform. If you are already a registered user of TheHindu Businessline and logged in, you may continue to engage with our articles. If you do not have an account please register and login to post comments. Users can access their older comments by logging into their accounts on Vuukle.