

As we close out the first half of 2024, the dramatic unfolding of the general elections has left a lasting mark on the Indian markets. The benchmark indices experienced a rollercoaster ride during the election season, with the volatility index, Nifty VIX, oscillating from a calm 10 in April to a turbulent 27 on June 4.
Nevertheless, with confidence back in the markets after high volatility on election day, the indices have ended the first half of the year near all-time high. How does H1 of 2024 compare with history?
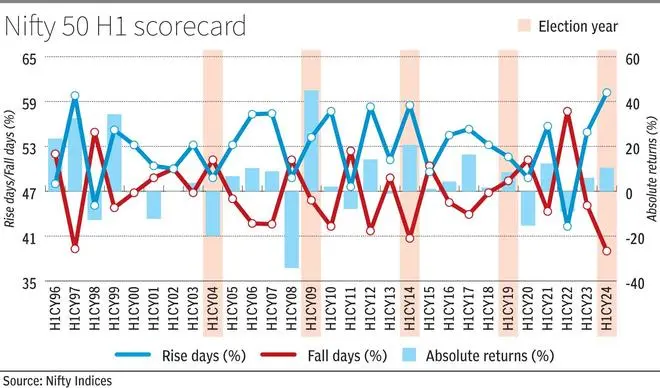
To begin with, the absolute returns of the Nifty 50 at 10 per cent in first half of 2024 is double the H1 average returns of 5.2 per cent for the index since its inception in November 1995. However, when we narrow down the comparison to election years, this is below the average of 13.2 per cent. This is when considering election years since 2004 (in 1999 elections were held in H2). This below-average performance can be attributed to government continuity i.e. markets had already factored it (coalition government not withstanding).
Hope for change
Significant outperformance in a few of election years earlier can be attributed to election verdicts reflecting hope for change. For example, in H1 CY2014, markets were up by 20 per cent as they gained confidence even before the results that a BJP-led NDA could form the government. Similarly in 2009 H1, Nifty 50 was up 45 per cent, enthused by the decisive mandate in favour of UPA. With the Nifty 50 hitting the upper circuit on the first trading day (May 18) after election results in 2009, it remains the best single-day performance of the index ever at 17.8 per cent.
Adjusted for these exceptional factors, this year’s performance fares well and matches the H1 2019 returns of 9 per cent.
However, apart from absolute returns in H1 2024, it also scores high when it comes to consistency in performance, election-related volatility notwithstanding. With 60 per cent of trading days turning out to be positive in H1 2024, this represents one of the most consistent performances of the index dating back to the first half of 1997. Optimism in markets can be measured in multiple ways and up days/down days ratio is one. On this count, the H1 performance ranks on top of the historical range of 42-60 per cent.
What’s ahead?
Since its inception, the Nifty 50 has averaged around 15 per cent annual gain. On average, the H2 in each year has fared better with 9 per cent returns, compared with H1 returns at 5.2 per cent. In election years, the average returns in the H2 have been at 18 per cent. Two-thirds of the time in the last 26 years, the H2 returns have been positive.
Historical data from election years 2004, 2009, 2014 and 2019, wherein results were announced in the first half, show that the share of daily gains either rose or remained the same in the second half.
This indicates that post-election stability and reduced uncertainty led to more positive trading days.
With wind in favour, factors to watch out for are elevated valuation levels, risk emanating from geopolitics, and elections in major economies like the US.
![]() Comments
Comments

Comments
Comments have to be in English, and in full sentences. They cannot be abusive or personal. Please abide by our community guidelines for posting your comments.
We have migrated to a new commenting platform. If you are already a registered user of TheHindu Businessline and logged in, you may continue to engage with our articles. If you do not have an account please register and login to post comments. Users can access their older comments by logging into their accounts on Vuukle.