Nifty 50 and Sensex fell last week in line with our expectation. But the Nifty Bank index on the other hand witnessed a strong bounce contrary to our expectation of seeing a fall. The index has risen well by about 1.8 per cent last week.
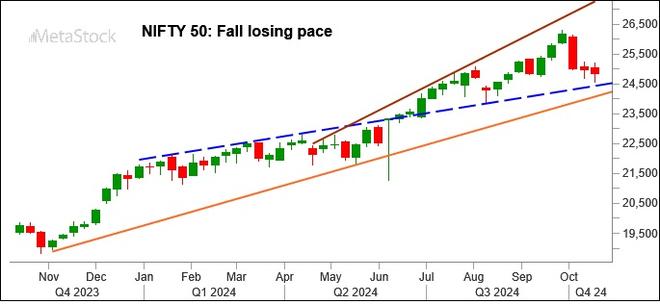
The strong bounce from the lows in the Sensex and Nifty on Friday has provided some relief. There is a head and shoulder bearish pattern formation visible on daily charts of Nifty and Sensex. Friday’s bounce has avoided this pattern formation for now. On the one hand, this could keep the indices vulnerable for a fall. A strong follow-through rise from here is necessary to completely negate the danger of this bearish pattern formation.
However, on the weekly chart, it is clear that the pace of the fall is slowing down. Also, supports are coming up for both the indices which can limit the downside.
As such, we can expect the downside to be limited from here. We see good chances for the Nifty, Sensex and the Nifty Bank indices to see a fresh rally in the coming weeks.
Non-stop selling
The selling spree of the foreign portfolio investors (FPIs) continues. They sold about $2.26 billion in the equity segment last week. So far in the first three weeks of this months, the Indian equity segment has seen a whopping foreign money outflow of about $9.25 billion. This can continue to keep the benchmark indices subdued going forward.
Nifty 50 (24,854.05)
The resistance at 25,200 continued to hold well as Nifty fell to a low of 24,567.65 last week. The index has risen back well from this low to close the week at 24,854.05, down 0.44 per cent.
Short-term view: Immediate support is at 24,650, the neckline of the head and shoulder pattern. If the Nifty sustains above this support, a rise to 25,000 and 25,200-25,300 is possible this week.
In case the Nifty falls below 24,650, it can test 24,550 and 24,400 on the downside. Thereafter it can see a rise towards 25,000 and 25,300.
Broadly, we expect the Nifty to rise back to 25,000-25,300 either from here itself or after a dip to 24,550-24,400.
This view will go wrong if the index declines below 24,400. In that case, a fall to 24,100 can be seen. That, in turn, will also confirm the head and shoulder pattern on the daily chart.

Chart Source: MetaStock
Medium-term view: As long as the Nifty stays above 24,000, there is no major threat for the broader uptrend. The recent fall is a correction within that. As such, our bullish view remains intact to see one more leg of rally to 27,400 and 27,950.
This bullish view will get negated only if the Nifty declines below 24,000. If that happens, we can see a fall to 23,000 and lower levels going forward.
We repeat that the levels of 27,400 and 27,950 are very strong resistances. The uptrend can halt anywhere there. So, as the Nifty approaches 27,400-27,950, we have to be more cautious, rather than becoming overly bullish. That will be the time to start looking at the market from the sell side.
Nifty Bank (52,094.20)
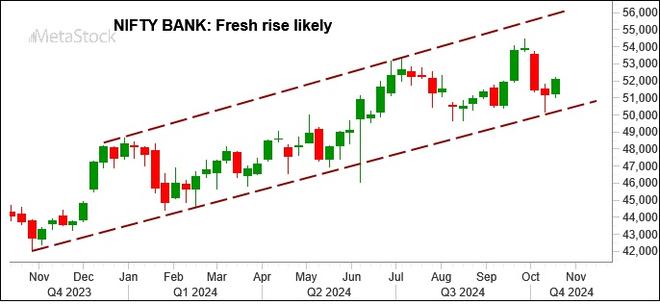
Nifty Bank index is managing to sustain well above 51,000. The index has risen and closed at 52,094.20, up 1.8 per cent. This has given some breather for the index.
Short-term view: Immediate support is at 51,000. Resistance is at 52,400. A break above it can take the index up to 52,700 initially. A further break above 52,700 will then clear the way for a rise to 54,000-54,500 in the short term.
The near-term outlook will turn negative only if the index declines below 51,000. If that happens, the Nifty Bank index can fall to 49,800-49,600 again.

Chart Source: MetaStock
Medium-term view: The broader picture remains bullish. On the monthly chart, there is a range of 49,650-54,470. Strong support is around 49,000. We reiterate that the Nifty Bank index has the potential to target 57,000-58,000 in the coming months as long as it stays above 49,000. So, dips below 50,000, if seen, will be a good buying opportunity from a long-term perspective.
The bullish view will go wrong only if the index declines below 49,000.
Sensex (81,224.75)
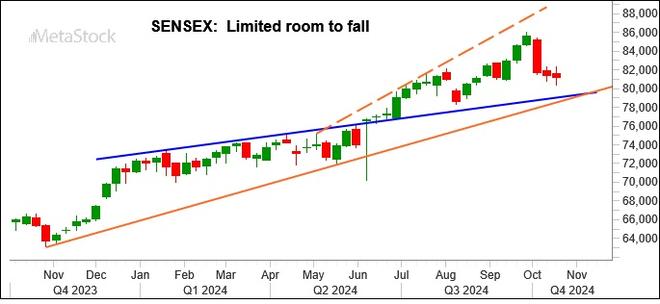
The fall below the support at 80,600 did not sustain. Sensex touched a low of 80,409.25 and then has risen back well. It has closed the week at 81,224.75, down 0.19 per cent.
Short-term view: Supports are at 80,550 and 80,300. If the Sensex manages to sustain above these supports, a rise to 82,300 is possible this week. A decisive break above 82,300 will then take the index up to 82,900 first, and then towards 84,000 in the short term.
The index will come under more selling pressure only if it declines below 80,300. In that case, a fall to 79,500-79,400 is possible.

Chart Source: MetaStock
Medium-term view: There is no change in the big picture. As long as the Sensex stays above 79,000, the uptrend will remain intact to see 85,000 first, and then 88,000-89,000 eventually in the coming months.
The outlook will turn negative only on a break below 79,000. Such a break can take the Sensex down to 77,500 and lower.
Dow Jones (43,275.91)
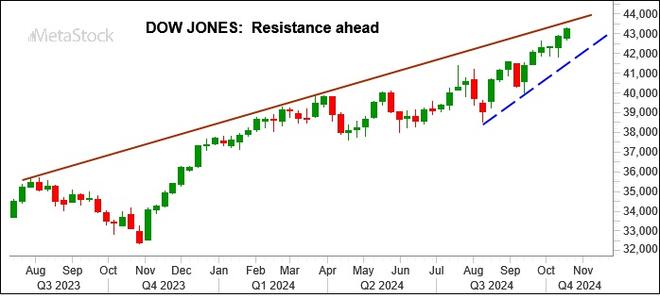
The rise to 43,300 happened last week in line with our expectation. The Dow Jones Industrial Average touched a new high of 43,325.09, and then has come off slightly from there. It has closed the week at 43,275.91, up 0.96 per cent.

Chart Source: MetaStock
Outlook: The broader bullish view is intact. Immediate resistance is in the 43,400-43,500 region. A break above it will clear the way for the rise to 44,300-44,500. The upmove can halt there. We can expect the Dow Jones to see a corrective fall from the 44,300-44,500 region towards 42,000 eventually in the coming months.
In case, the Dow fails to breach 43,500 now, it can see a dip to 43,000 or 42,500 first and then see the rise to 44,300-44,500.


Comments
Comments have to be in English, and in full sentences. They cannot be abusive or personal. Please abide by our community guidelines for posting your comments.
We have migrated to a new commenting platform. If you are already a registered user of TheHindu Businessline and logged in, you may continue to engage with our articles. If you do not have an account please register and login to post comments. Users can access their older comments by logging into their accounts on Vuukle.