

The much-awaited Fed pivot is finally on the horizon. Last Friday, Federal Reserve Chairman Jerome Powell, in his speech at the famed annual Jackson Hole Economic Symposium, noted that ‘time has come for policy to adjust’, which clearly hints at rate cuts in the US in the upcoming FOMC meeting in September. Stock and bond markets cheered, as they always have in the past.
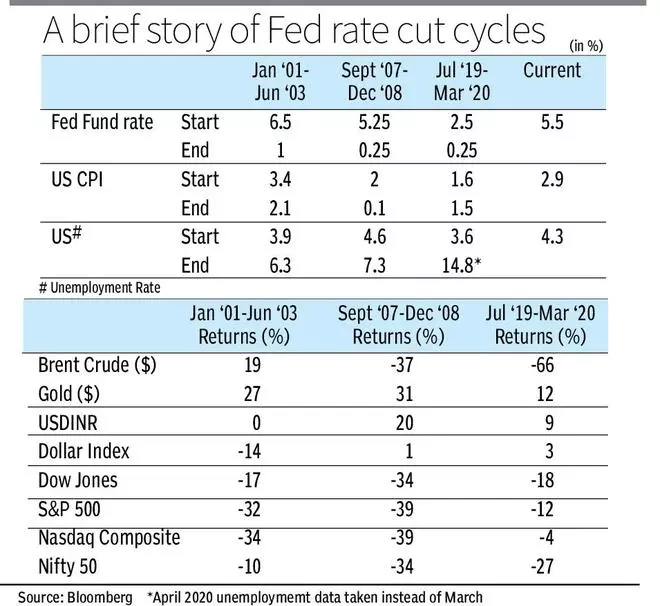
In the last 25 years, there have been three rate-cut cycles in the US and the initial reaction on the eve of the first such action has always been positive. But how was the follow-through as the rate-cut cycle continued? Here are some insights on how different asset classes and key macro metrics fared during previous rate-cut cycles (also see table) and the takeaways for investors. For this analysis, we have considered changes starting from the month of the first rate-cut to month of the last rate-cut in the cycle.
An analysis of the events following the start of the rate- cut cycle gives a message that one needs to be careful on what one wishes for (lower interest rates).
Glass half full?
When the rate-cut cycle starts, the battle is only half won. Victory over inflation can be declared only when an economic soft landing is confirmed, on which there will be clarity only some time next year.
The last three times the Fed embarked on cutting rates, the US economy eventually ended in a recession. Even in 2020, when the recession was triggered by the Covid-19 pandemic, the economy was showing signs of slowing. Going back to earlier periods also, many rate-cut cycles had ended in a recession. Soft landings have been rare, but was once achieved during a cycle in the mid-1990s.
Each cycle had some different dynamics. In 2000, the economy/markets had already started weakening/correcting before rate cuts, whereas in 2007 both continued to strengthen/rally for a few months even after the rate cuts, the end result is that across different periods economy/markets have had a painful time during the previous rate-cut cycles.
During the 2001-03 rate-cut cycle, the Dow Jones, S&P500 and Nasdaq Composite fell by 17, 32 and 34 per cent, respectively, while the Nifty 50 fared better with a decline of 10 per cent. While in India, too, the bear market was severe during that cycle, the recovery phase had started by early 2003. To the contrary, the pain continued even after the 30-40 per cent correction all four indices had endured by time of the last rate cut in the September 2007 to December 2008 rate-cut cycle.
Gold was the outperformer across these cycles, yielding strong returns in dollar terms and even stronger after factoring for the depreciation in the Indian Rupee (USDINR) in the 2007-08 and 2019-20 cycles.
How should investors position
Soft landing remains a possibility, just that investors have to live with a view now that it is not a certainty.
Given this, some hedging of portfolio by increasing allocation to gold and fixed income might make for a good move. This apart, investors need to keenly track how unemployment rate trends in the US over the next few months. When investors try to analyse the reasons why rate-cut cycles have been bad for markets overall, one data to check is what are the factors that trigger the rate cut.
The increase in unemployment rates is a factor that influences the start of the rate cut cycle as the US Fed tries to balance its dual mandate of price stability and maximum employment. It’s the same this time, too, with Sahm Rule recession indicator getting triggered with the July unemployment report. When unemployment increases, spending in the consumption driven US economy gets impacted, triggering a slowdown/recession, having ripple effects in economies and markets across the world.
![]() Comments
Comments

Comments
Comments have to be in English, and in full sentences. They cannot be abusive or personal. Please abide by our community guidelines for posting your comments.
We have migrated to a new commenting platform. If you are already a registered user of TheHindu Businessline and logged in, you may continue to engage with our articles. If you do not have an account please register and login to post comments. Users can access their older comments by logging into their accounts on Vuukle.